TPI VibTrend Machine Vibration Analysis Software for TPI 9080 Instrument
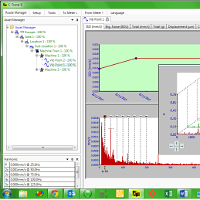
The TPI VibTrend machine vibration analysis software is an easy-to-use, Windows 7/10-based data storage, trend analysis, vibration analysis, and reporting PC software for the TPI STM 9080 type vibration data collector instrument. Its functions include manual instrument route programming, data reception and storage, graphical display of trends, spectra, and waterfall plots, automatic threshold value evaluation, and report generation. Instant Data and Threshold Value Display Machine groups, machines, and measurement points can be easily and quickly created and named as desired. Each element receives a separate color code based on the latest measurement data in the route/instrument to visually indicate the machine's condition at a glance (red - critical / yellow - warning / green - normal). Vibration levels and bearing condition values for each measurement point can be easily set for predictive and alarm threshold values, providing immediate notification (within the database structure) after data upload if the machine vibration or bearing condition has reached or exceeded the preset threshold values. Easy Vibration Spectrum and Waterfall Plot Acceleration and vibration velocity values characteristic of machine and bearing conditions can be displayed instantly with a single click from the measurements stored in the TPI VibTrend machine vibration analysis software. The trend and spectrum of measured data specific to the machine can also be displayed. Simply select the machine within the appropriate machine group, the measurement location, and the assigned measurement direction, and the requested graphical display is readily available. A visual comparison and graphical representation of past measurements provide information on the machine's deterioration rate. Comparison and Evaluation with Auxiliary Tools The displays are freely zoomable and scalable. Viewing and comparing one or more spectra, trends, waterfall plots, and other data displays simultaneously is possible. Spectrum evaluation can be done with simple, multiple, or even sideband cursors that can be synchronized for arbitrary spectra. An auxiliary table prepared according to ISO 10816-3 provides assistance for evaluating the effective value and trend, and the background color of trends helps identify threshold exceedances. One-Click Report Generation Reports on conducted measurements, observed or critical machines, or changes in individual machines can be generated with a single click. Reports can be exported to Word, allowing for post-editing and reprinting.
No further information available.